Watchlog USB Dual Pressure and Temperature Sensor
Watchlog USB Windows® PC/tablet pressure & temperature measurement software
Watchlog Bluetooth Sensors, Gauges and Mobile Apps
Watchlog Bluetooth Pressure & Temperature Sensors, Gauges and App for up to 4 sensors connected simultaneously
WLB-PT Compact Bluetooth Pressure Sensor
WLB-TT Compact Bluetooth Temperature Sensor
WLB-DDPG Series Bluetooth Digital Datalogging Pressure Gauges
WLB-DPG Series Watchlog Bluetooth Digital Pressure Gauge
Watchlog Bluetooth Live View & Datalogging App for iOS and Android
DDPG Series Digital Datalogging Bluetooth Pressure Gauge & Minimess® Test Kit
DPG Series Digital Bluetooth Pressure Gauge & Minimess® Test Kit
Watchlog Bluetooth-Plus Pressure, Level & Force Sensors and App for up to 12 connected sensors & advanced app calculation features
HT-WLBP Watchlog Bluetooth-Plus Pressure Sensor
HT-WLBL Watchlog Bluetooth-Plus Hydrostatic Level Sensors
HT-WLBLC Watchlog Bluetooth-Plus Compression Load Cells
HT-WLBLL Watchlog Bluetooth-Plus Compression Load Link
Watchlog Bluetooth-Plus iOS and Android App
Watchlog Wireless Pressure, Temperature and Flow Sensors
Watchlog Wireless Pressure, Flow & Temperature Test Kit
Watchlog ATEX Wireless Pressure Sensors
Watchlog Wireless Pressure Sensors
Watchlog Wireless Temperature Sensors
Watchlog Wireless Linear Position Sensor
Watchlog Wireless Turbine Flow Meters
Watchlog Wireless Oval Gear Flow Meters
Watchlog Wireless USB Base Stations / Receivers
WLW-AR Wireless Signal Extender
Watchlog Wireless Signal Gateway Modules
Watchlog Wireless Config, Monitoring & Logging Software
Watchlog Wireless Accessories
WLWPL Series Cellular Level Sensor
Watchlog Pro Remote Monitoring
Watchlog PRO ORB Cellular / Wi-Fi Cloud Gateway for Mobile Applications
Watchlog PRO QUAD Cellular / Wi-Fi Cloud Gateway for Fixed Systems
Watchlog Pro Hydraulic System Monitoring
Watchlog PRO Custom Cloud Monitoring
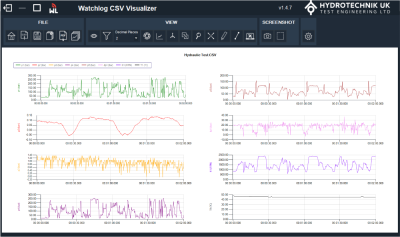
Watchlog CSV Visualizer Software